How to Build a Free Open-Source SOC
Tutorial**Why Build Your Own SOC?**
A Security Operations Center (SOC) used to mean expensive commercial licenses, dedicated hardware, and a team of analysts. That's no longer true. With Proxmox as your hypervisor and a handful of best-in-class open-source tools, a single IT administrator can stand up a fully functional SOC capable of monitoring servers, detecting network intrusions, visualizing system health, and pushing real-time alerts to email and Telegram — all for the cost of the hardware you already own.
This guide walks through the exact stack and commands used to build a working SOC for a small office/hospital ICT environment, end to end:
• Proxmox VE — the hypervisor hosting everything
• Wazuh — SIEM, endpoint detection, and compliance dashboards
• Suricata — network intrusion detection (IDS)
• Prometheus + Grafana — infrastructure metrics and dashboards
• Email + Telegram — real-time alert notifications
Estimated time: 3–5 hours for a first-time build. Difficulty: Intermediate — comfort with Linux command line is helpful but every command is provided exactly as run.
**Prerequisites**
• A server or workstation with Proxmox VE already installed
• At minimum: 8 CPU cores, 16 GB RAM, 100+ GB free storage (more is better — this guide used a host with 62 GB RAM and 5+ TB storage)
• A network connection with internet access for downloading packages
• A free Gmail account (for email alerts) and a Telegram account (for chat alerts)
**Architecture Overview**
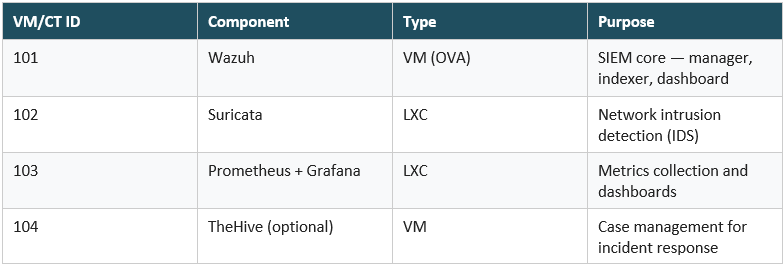
Each major component runs as its own isolated guest on Proxmox — either a full VM or a lightweight LXC container — which keeps the stack easy to back up, snapshot, and troubleshoot independently.
<div align="center">
Phase 1: Deploying Wazuh on Proxmox
</div>
Wazuh is the heart of the SOC — it's the SIEM that collects logs, correlates events into alerts, and gives you the dashboard you'll live in day to day. The fastest deployment path is Wazuh's official pre-built OVA, which bundles the manager, indexer, and dashboard into a single virtual appliance.
**Step 1.1 — Download the Wazuh OVA**
Download the latest Wazuh OVA from the official documentation page:
https://documentation.wazuh.com/current/deployment-options/virtual-machine/virtual-machine.html
At the time of this build, the latest version was Wazuh 4.14.5. Upload the .ova file to your Proxmox node's local storage (Datacenter → your node → local → Import).
**Step 1.2 — Fix Storage Content Type (common error)**
If you try to import the OVA through the GUI and get the error below, it's because your local storage isn't configured to accept disk images by default:
Parameter verification failed. (400)
ide0: import working storage 'local' does not support 'images' content type or is not file based.
Fix it by enabling the images content type on local storage from the Proxmox shell:
pvesm set local --content iso,backup,images,rootdir
This is the single most common blocker when importing any OVA into Proxmox for the first time — worth remembering for future imports too.
**Step 1.3 — Import the OVA via Command Line (most reliable)**
The Proxmox GUI importer can be finicky depending on where the uploaded OVA actually lands on disk. The CLI method below is the most reliable path and is what was used in this build.
First, locate the uploaded OVA (Proxmox sometimes stores it under /var/lib/vz/import/ rather than the ISO folder):
find / -name "wazuh*.ova" 2>/dev/null
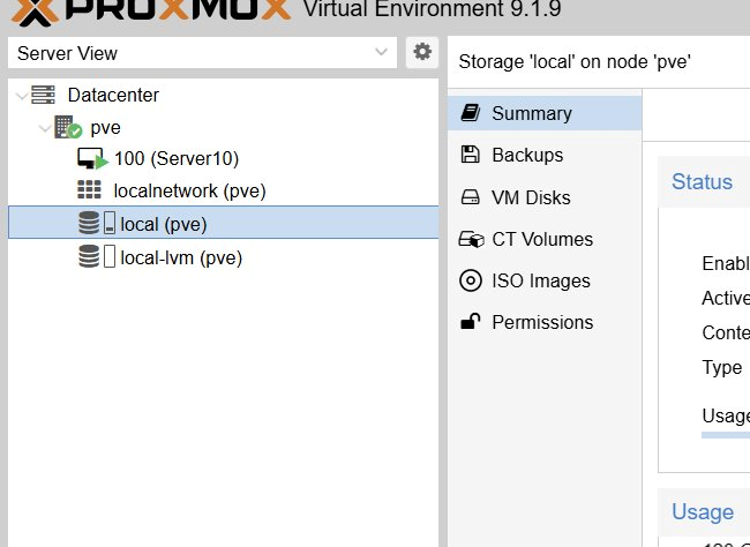
Locating the uploaded OVA under Datacenter → local → Import
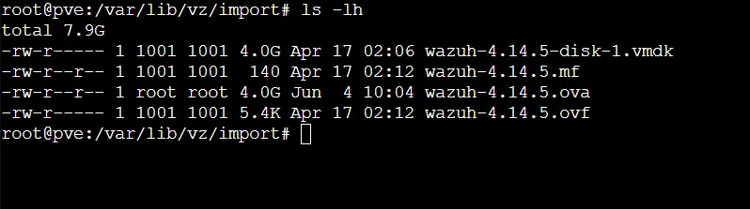
Extract the OVA — it's just a tar archive containing the disk image:
cd /var/lib/vz/import/
tar xvf wazuh-4.14.5.ova
ls -lh
Create the VM shell, then import the extracted .vmdk into it:
qm create 101 --name Wazuh-4.14.5 --memory 8192 --cores 4 \
--net0 virtio,bridge=vmbr0 --ostype l26
qm importdisk 101 wazuh-4.14.5-disk-1.vmdk local-lvm
**Step 1.4 — Attach the Disk and Configure Boot**
qm set 101 --scsi0 local-lvm:vm-101-disk-0
qm set 101 --ide2 none,media=cdrom
qm set 101 --boot order=scsi0
qm set 101 --serial0 socket --vga serial0
**Step 1.5 — Fix CPU Compatibility (common error)**
On first boot you may hit a CPU compatibility error if your physical CPU doesn't support the instruction set the OVA was built for:
Fatal glibc error: CPU does not support x86-64-v2
Fix it by passing your host CPU through directly instead of emulating a generic profile:
qm stop 101
qm set 101 --cpu host
qm start 101
**Step 1.6 — Boot and First Login**
qm start 101
Open the Console tab for the VM in Proxmox. Wazuh's Amazon Linux base takes 1–2 minutes to finish booting on first start — press Enter once it settles to see the login banner.
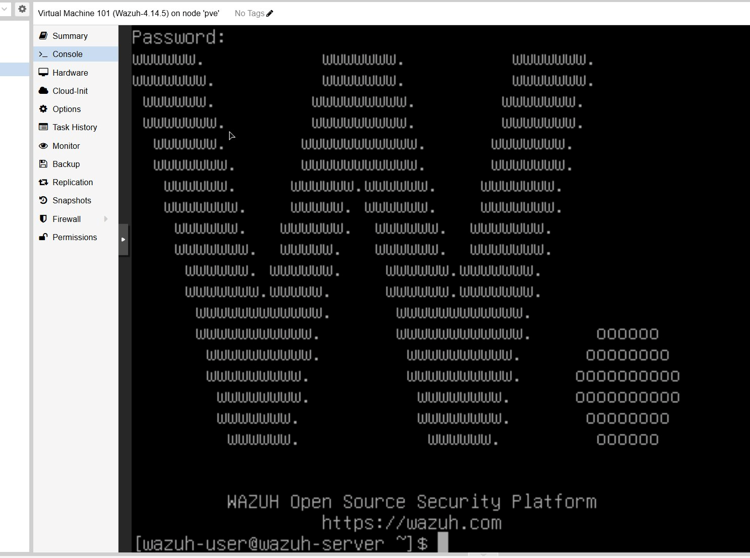
Find the VM's IP address from inside the console:
ip a
Then open a browser to the IP shown (e.g. https://10.5.49.164) and log in with the default credentials, changing the password immediately on first login:
Username: admin
Password: admin
**Step 1.7 — Set a Static IP (so it survives reboots)**
By default the OVA uses DHCP. Edit the network config to lock in a permanent address:
sudo nano /etc/sysconfig/network-scripts/ifcfg-eth0
DEVICE=eth0
BOOTPROTO=none
ONBOOT=yes
TYPE=Ethernet
IPADDR=10.5.49.164
PREFIX=22
GATEWAY=10.5.48.1
DNS1=8.8.8.8
DNS2=1.1.1.1
Apply and verify:
sudo systemctl restart network
ip a | grep inet
Reboot the VM once after this change and confirm the dashboard still loads at the same IP — that confirms the static IP survives a restart.
**Step 1.8 — Deploy Your First Agent**
From the Wazuh dashboard: Endpoints → Deploy new agent. Choose the OS of the machine you want to monitor, enter the Wazuh server address, give the agent a name, and the dashboard generates the exact install command to run on that target machine.
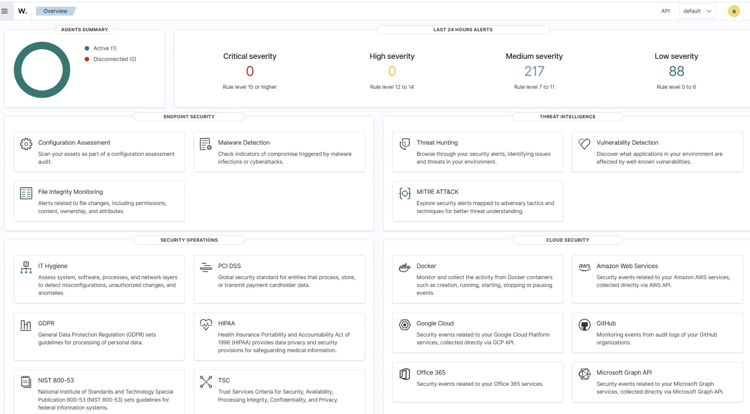
Wazuh Overview dashboard with an active agent reporting alerts
Phase 1 complete: Wazuh SIEM is live, accessible on a static IP, and receiving data from at least one endpoint agent.
<div align="center">
Phase 2: Deploying Suricata (Network IDS)
</div>
Suricata watches raw network traffic and flags known attack signatures, port scans, and suspicious protocol behavior. Deploying it as a lightweight LXC container keeps resource usage minimal.
**Step 2.1 — Create the Suricata LXC Container**
pveam update
pveam download local ubuntu-22.04-standard_22.04-1_amd64.tar.zst
If you see “storage 'local' does not support templates”, run: pvesm set local --content iso,backup,images,rootdir,vztmpl
pct create 102 local:vztmpl/ubuntu-22.04-standard_22.04-1_amd64.tar.zst \
--hostname suricata --memory 2048 --cores 2 \
--rootfs local-lvm:20 --net0 name=eth0,bridge=vmbr0,ip=dhcp \
--password suricata123 --unprivileged 1 --start 1
**Step 2.2 — Enter the Container and Fix DNS**
LXC containers on a network with a custom gateway sometimes can't resolve external DNS by default. Point resolv.conf at your gateway and a public resolver:
pct enter 102
printf "nameserver 10.5.48.1\nnameserver 8.8.8.8\n" > /etc/resolv.conf
ping -c 2 google.com
If your network has firewall/hotspot restrictions that block container IPs from reaching the internet directly, whitelist the container's IP (shown by 'ip a') on your gateway/hotspot, or fetch packages on the Proxmox host and push them into the container with 'pct push' instead.
**Step 2.3 — Install Suricata**
apt update && apt upgrade -y
apt install software-properties-common -y
add-apt-repository ppa:oisf/suricata-stable -y
apt install suricata -y
suricata-update
**Step 2.4 — Configure and Start Suricata**
sed -i 's/community-id: false/community-id: true/' /etc/suricata/suricata.yaml
systemctl restart suricata
systemctl status suricata --no-pager

Suricata service active and running with 374 rules loaded
**Step 2.5 — Install the Wazuh Agent on the Suricata Container**
This is what ships Suricata's network alerts into the Wazuh dashboard for correlation alongside your endpoint logs.
apt install curl -y
curl -o /tmp/wazuh.key https://packages.wazuh.com/key/GPG-KEY-WAZUH
gpg --no-default-keyring --keyring gnupg-ring:/usr/share/keyrings/wazuh.gpg \
--import /tmp/wazuh.key
chmod 644 /usr/share/keyrings/wazuh.gpg
echo "deb [signed-by=/usr/share/keyrings/wazuh.gpg] \
https://packages.wazuh.com/4.x/apt/ stable main" | \
tee /etc/apt/sources.list.d/wazuh.list
apt update && WAZUH_MANAGER='10.5.49.164' apt install wazuh-agent -y
systemctl enable wazuh-agent && systemctl start wazuh-agent
Tell the agent to forward Suricata's eve.json log to Wazuh:
cat >> /var/ossec/etc/ossec.conf << 'EOF'
<ossec_config>
<localfile>
<log_format>json</log_format>
<location>/var/log/suricata/eve.json</location>
</localfile>
</ossec_config>
EOF
systemctl restart wazuh-agent
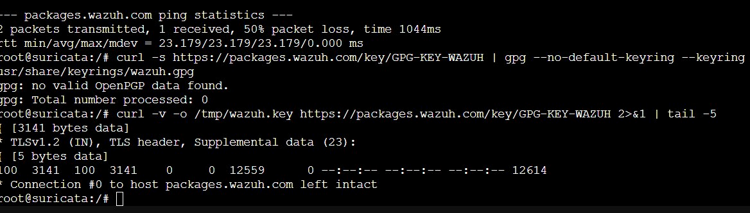
Wazuh agent active on the Suricata container, shipping network alerts
Phase 2 complete: Suricata is actively inspecting traffic and forwarding alerts into Wazuh as a second monitored agent.
<div align="center">
Phase 3: Prometheus + Grafana (Metrics & Dashboards)
</div>
While Wazuh handles security events, Prometheus and Grafana give you visibility into system health — CPU, memory, disk, and network trends over time. This guide deploys both inside a single LXC container.
**Step 3.1 — Create the Monitoring Container**
pct create 103 local:vztmpl/ubuntu-22.04-standard_22.04-1_amd64.tar.zst \
--hostname monitoring --memory 2048 --cores 2 \
--rootfs local-lvm:20 --net0 name=eth0,bridge=vmbr0,ip=dhcp \
--password monitor123 --unprivileged 1 --start 1
pct enter 103
printf "nameserver 10.5.48.1\nnameserver 8.8.8.8\n" > /etc/resolv.conf
apt update && apt upgrade -y
**Step 3.2 — Download Binaries (host-side fallback)**
If your network blocks direct container internet access, download on the Proxmox host (which already has internet) and push the files into the container — this completely bypasses any container-level network restriction:
On the Proxmox host:
cd /tmp
wget https://github.com/prometheus/prometheus/releases/download/v2.51.2/prometheus-2.51.2.linux-amd64.tar.gz
wget https://dl.grafana.com/oss/release/grafana_10.4.2_amd64.deb
wget https://github.com/prometheus/node_exporter/releases/download/v1.7.0/node_exporter-1.7.0.linux-amd64.tar.gz
pct push 103 /tmp/prometheus-2.51.2.linux-amd64.tar.gz /tmp/prometheus.tar.gz
pct push 103 /tmp/grafana_10.4.2_amd64.deb /tmp/grafana.deb
pct push 103 /tmp/node_exporter-1.7.0.linux-amd64.tar.gz /tmp/node_exporter.tar.gz
**Step 3.3 — Install Everything Inside the Container**
pct enter 103
cd /tmp
Prometheus
tar xzf prometheus.tar.gz
mv prometheus-2.51.2.linux-amd64/prometheus /usr/local/bin/
mv prometheus-2.51.2.linux-amd64/promtool /usr/local/bin/
mkdir -p /etc/prometheus /var/lib/prometheus
mv prometheus-2.51.2.linux-amd64/prometheus.yml /etc/prometheus/
Node Exporter
tar xzf node_exporter.tar.gz
mv node_exporter-1.7.0.linux-amd64/node_exporter /usr/local/bin/
Grafana
apt install -y adduser libfontconfig1 musl
dpkg -i /tmp/grafana.deb
**Step 3.4 — Create systemd Services and Configure Scraping**
cat > /etc/systemd/system/prometheus.service << 'EOF'
[Unit]
Description=Prometheus
After=network.target
[Service]
ExecStart=/usr/local/bin/prometheus \
--config.file=/etc/prometheus/prometheus.yml \
--storage.tsdb.path=/var/lib/prometheus
Restart=always
[Install]
WantedBy=multi-user.target
EOF
cat > /etc/systemd/system/node_exporter.service << 'EOF'
[Unit]
Description=Node Exporter
After=network.target
[Service]
ExecStart=/usr/local/bin/node_exporter
Restart=always
[Install]
WantedBy=multi-user.target
EOF
Tell Prometheus to actually scrape node_exporter — this step is easy to miss and leaves Grafana showing “No data”:
cat > /etc/prometheus/prometheus.yml << 'EOF'
global:
scrape_interval: 15s
scrape_configs:
- job_name: 'prometheus'
static_configs:
- targets: ['localhost:9090']
- job_name: 'node_exporter'
static_configs:
- targets: ['localhost:9100']
EOF
systemctl daemon-reload
systemctl enable --now prometheus node_exporter grafana-server
**Step 3.5 — Configure Grafana**
Open http://<container-ip>:3000 and log in with the default admin/admin credentials (you'll be prompted to change it). Then:
1. Connections → Data sources → Add data source → Prometheus, URL: http://localhost:9090, click Save & test
2. Dashboards → New → Import → enter dashboard ID 1860 (Node Exporter Full) → Load → Import
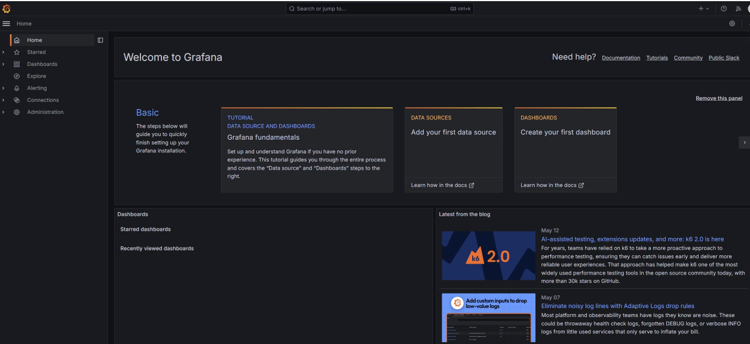
Grafana home screen after first login
Once the Job and Instance filters are set to node_exporter, live metrics populate immediately:
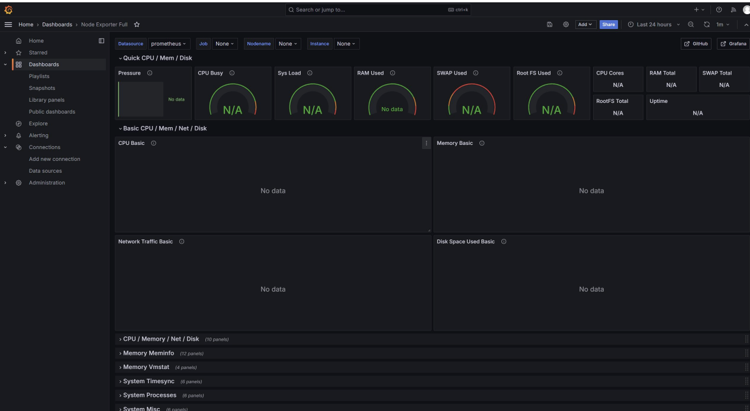
Grafana dashboard showing live CPU, memory, disk, and network metrics
Phase 3 complete: Prometheus is scraping metrics and Grafana is rendering live infrastructure dashboards.
<div align="center">
**Phase 4: Real-Time Alerts — Email and Telegram**
</div>
A SOC that no one checks isn't a SOC — it's a log archive. The final piece is pushing high-severity alerts directly to your inbox and phone the moment they happen.
**Step 4.1 — Configure Wazuh Email Alerts**
Edit the global block in Wazuh's main config file:
sudo nano /var/ossec/etc/ossec.conf
<global>
<jsonout_output>yes</jsonout_output>
<alerts_log>yes</alerts_log>
<logall>no</logall>
<logall_json>no</logall_json>
<email_notification>yes</email_notification>
<smtp_server>localhost</smtp_server>
<email_from>yourname@gmail.com</email_from>
<email_to>yourname@gmail.com</email_to>
<email_to>second.recipient@gmail.com</email_to>
<email_maxperhour>12</email_maxperhour>
<email_log_source>alerts.log</email_log_source>
<agents_disconnection_time>15m</agents_disconnection_time>
<agents_disconnection_alert_time>0</agents_disconnection_alert_time>
<update_check>yes</update_check>
</global>
<alerts>
<log_alert_level>3</log_alert_level>
<email_alert_level>10</email_alert_level>
</alerts>
Multiple recipients are supported by simply repeating the <email_to> tag — there's no limit beyond your maxperhour throughput.
**Step 4.2 — Get a Gmail App Password**
Gmail blocks direct password login from scripts, so a 16-character App Password is required:
3. Enable 2-Step Verification on the Gmail account (myaccount.google.com → Security)
4. Security → App passwords → name it “Wazuh” → Create
5. Copy the 16-character password shown — it's only displayed once
**Step 4.3 — Install and Configure Postfix as the SMTP Relay**
sudo yum install postfix cyrus-sasl-plain mailx -y
sudo tee -a /etc/postfix/main.cf << 'EOF'
relayhost = [smtp.gmail.com]:587
smtp_sasl_auth_enable = yes
smtp_sasl_password_maps = hash:/etc/postfix/sasl_passwd
smtp_sasl_security_options = noanonymous
smtp_tls_security_level = encrypt
smtp_tls_CAfile = /etc/ssl/certs/ca-bundle.crt
EOF
sudo bash -c 'echo "[smtp.gmail.com]:587 yourname@gmail.com:yourapppassword" \
> /etc/postfix/sasl_passwd'
sudo chmod 600 /etc/postfix/sasl_passwd
sudo postmap /etc/postfix/sasl_passwd
sudo systemctl enable --now postfix
# Test it:
echo "Test from Wazuh SOC" | mail -s "Wazuh Test" yourname@gmail.com
sudo systemctl restart wazuh-manager
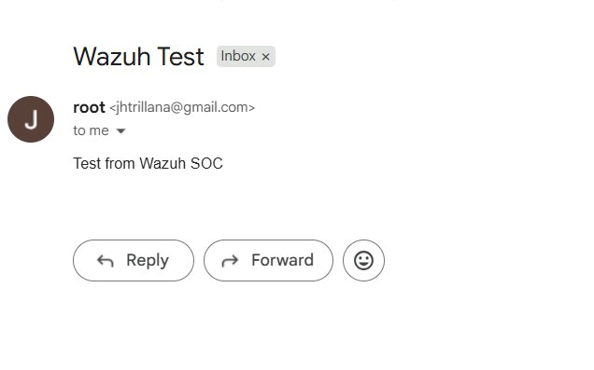
Test email successfully delivered via the Postfix → Gmail relay
**Step 4.4 — Set Up a Telegram Bot (faster than Viber, no business approval needed)**
6. In Telegram, message @BotFather and send /newbot
7. Give it a name and a username ending in _bot — BotFather returns a token
8. Message your new bot (click Start, send any text)
9. Open https://api.telegram.org/bot<TOKEN>/getUpdates in a browser and copy the chat.id value — that's your Chat ID
**Step 4.5 — Build the Telegram Integration Script**
sudo cat > /var/ossec/integrations/custom-telegram << 'EOF'
#!/usr/bin/env python3
import sys, json, urllib.request
TELEGRAM_TOKEN = "YOUR_BOT_TOKEN"
CHAT_ID = "YOUR_CHAT_ID"
def send_telegram(message):
url = f"https://api.telegram.org/bot{TELEGRAM_TOKEN}/sendMessage"
data = json.dumps({
"chat_id": CHAT_ID,
"text": message,
"parse_mode": "HTML"
}).encode("utf-8")
req = urllib.request.Request(url, data=data,
headers={"Content-Type": "application/json"})
urllib.request.urlopen(req)
alert_file = open(sys.argv[1])
alert = json.load(alert_file)
alert_file.close()
level = alert["rule"]["level"]
desc = alert["rule"]["description"]
agent = alert.get("agent", {}).get("name", "Unknown")
msg = f"\U0001F6A8 <b>Wazuh SOC Alert</b>\n<b>Level:</b> {level}\n" \
f"<b>Agent:</b> {agent}\n<b>Rule:</b> {desc}"
send_telegram(msg)
EOF
sudo chmod 750 /var/ossec/integrations/custom-telegram
sudo chown root:wazuh /var/ossec/integrations/custom-telegram
Register the integration in ossec.conf, just before the closing </ossec_config> tag:
<integration>
<name>custom-telegram</name>
<level>10</level>
<alert_format>json</alert_format>
</integration>
sudo systemctl restart wazuh-manager
**Step 4.6 — Test It**
Trigger a real brute-force alert by attempting several failed SSH logins:
for i in {1..10}; do ssh invalid@localhost; done
press Enter through each failed password prompt
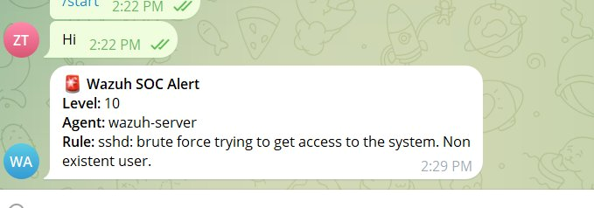
A live Wazuh brute-force alert arriving in Telegram
Phase 4 complete: high-severity Wazuh alerts now land in both email and Telegram in real time.
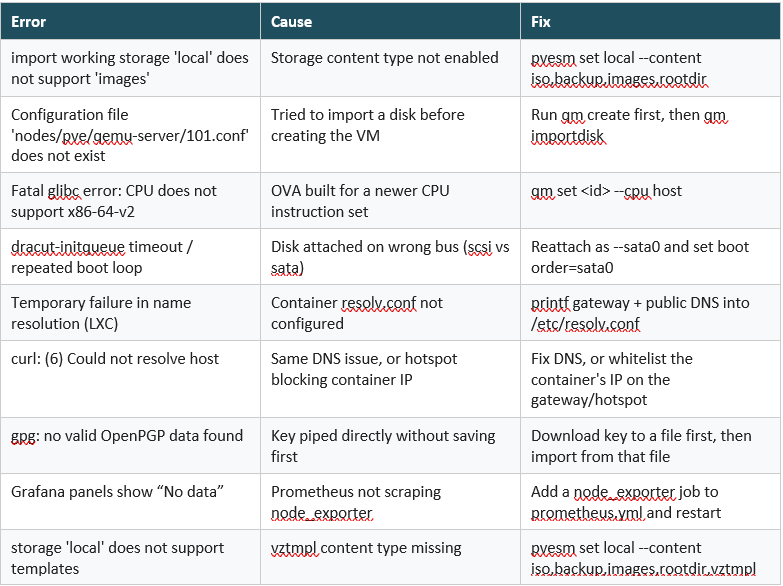
**Common Errors and Fixes**
**What's Next: Extending the SOC**
With the core four phases running, a few additions meaningfully raise the maturity of a one-person SOC:
• TheHive — proper incident case tracking instead of relying on memory
• MISP — threat intelligence feeds to auto-tag known-bad IPs and file hashes
• OpenVAS/Greenbone — scheduled vulnerability scanning across all assets
• Cloud log forwarding — pipe AWS CloudTrail / GCP audit logs into Wazuh for hybrid visibility
• Wazuh Active Response — auto-block IPs on confirmed brute-force attempts
**Final Result**
By the end of this build: Wazuh is correlating endpoint and network events from multiple agents, Suricata is inspecting all network traffic for known attack signatures, Grafana is visualizing live system health, and every high-severity event reaches you by email and Telegram within seconds — all running on infrastructure you already own, using entirely free and open-source software.
If you run into an error not covered in the troubleshooting table above, the most common culprits are storage content-type settings, DNS inside LXC containers, and disk bus mismatches — check those three first.
To download a PDF copy of the article, click the button below:
[PREMIUM]
[💾 Download File](https://docs.google.com/document/d/1T8R2qBQ9oG18iUoTTkpWYWTPZUDZfEJo/edit?usp=sharing&ouid=115988588070178171569&rtpof=true&sd=true)
[/PREMIUM]
By John Hedwig Trillana•6/20/2026